


It has come to my attention that I haven't posted a stats focused article here since the now distant year of 2025. I know how important graphs and charts are to you, dear reader, so I apologize for any related gap in data visualizations.
No small part of that gap is due to the fact that... well there really isn't enough data available, so far in 2026, to make a chart.
New England has played 4 matches so far this season, which is inclusive of a grass-fueled postponement back on March 7th. Who could have predicted that weather would interfere with winter-scheduled matches in New England?
New England is playing under a new head coach and under a new system than they did last season. A lot of those changes in setup won't become obvious in the stats until well into the season. Furthermore, head coach Marko Mitrovic has no previous MLS head-coaching experience. This makes it difficult to accurately predict statistical trends based on his previous coaching record.
All of this to say, there isn't really a whole lot of data available. And the data that we do have comes from small sample sizes which means individual matches still have a high likelihood of swaying the dataset.
It would be downright irresponsible to even attempt to make predictions or draw conclusions from such a limited amount of information.
Keep all of that in mind while I attempt to make some predictions and draw some conclusions from the Revs first 4 games.
Fewer Crosses
If it has felt like the Revs are spending less time aimlessly drifting crosses into the box this year it's because - so far - that's been true.
New England through 4 matches average somewhere between 9 and 13 crosses per match (depending on data source). Using FBRef data they're crossing about 33% less than last season. In 2025 the Revolution attempted the 3rd most crosses per match (despite completing those crosses at the 5th lowest rate in the league). In a limited number of games this year it's down to 6th fewest crosses-per-90.
This chart shows MLS team crosses per 90 value change from 2025 to 2026. No team experienced a larger percent change (in either direction) than the Revs, year-over-year. They averaged 20 crosses per match last season, down significantly to 13 in 2026.
Obviously there's a lot of uncertainty inherent in the small sample size, but if it holds it would appear to be a recognition that crossing wasn't a successful means of creating danger with this group of players in previous seasons.
This isn't to say that they've completely changed up their tactical strategy, however.
Possession Focus - But With Speed?
A hallmark of Caleb Porter's Revolution teams was a fanatical commitment to 'playing with the ball'. In theory it was supposed to make use of smart spacing and side-to-side passing to create gaps and open weak points to advance the ball. There was no real change of pace to their setup, however. Slow, measured buildups meant opting for safe (often negative) passes to keep the ball moving. Defensively, they mostly aimed to play compact, applying only light pressure before the opponent reached the final third.
Some people would argue that this slow pace of play made the Revs of 2024/2025 fairly predictable and would give their opponents too much time to react and set their defensive shape.
It's me. I'm some people.
What that sort of low press/high possession model looks like, from a stats perspective, is as follows:
- Low 'direct speed'
- Long 'sequence time'
- High 'passes per defensive action'
- Small 'start distance'
- High 'backwards pass percentage'
- Low 'direct attacks per 90'
- Low 'fast breaks per 90'
This season, a lot of those metrics look similar. Per the Opta Analyst, the 2026 Revs have bottom 5 'direct speed' and top 10 longest 'sequence time'. They allow the 4th most passes before a defensive action and their average start position is 6th closest to their own goal. They pass backwards at the 3rd highest rate in the league.
One encouraging difference, however, is that they actually do appear willing and capable to take advantage of a direct attack when the opportunity presents itself.
Yes, Ilay Feingold needs to finish here, but the run is positive.
— Seth (@SethMan31) March 22, 2026
The addition of Alhassan Yusuf has been helpful.#NERevs pic.twitter.com/9yVDa7bdr1
As with all of these stats, low sample size caveats apply. However, the Revs actually rank within the top 1/3 of the league in 'direct attacks per 90' – tied for 6th most with 2 direct attacks per match. They also rank 4th in the league so far in 'fast breaks per 90' with 1.5.
It's a strategy they may want to lean into because they still haven't shown an ability to turn that possession focus into danger. They remain bottom 1/3 in 'touches in the opponent's penalty area' - though even that is up slightly from last season (19.24 tPA/90 to 21.25 so far in 2026).
Matt Turner Still Very Good
Matt Turner came back to New England last summer after playing for the Revs from 2018-2022.
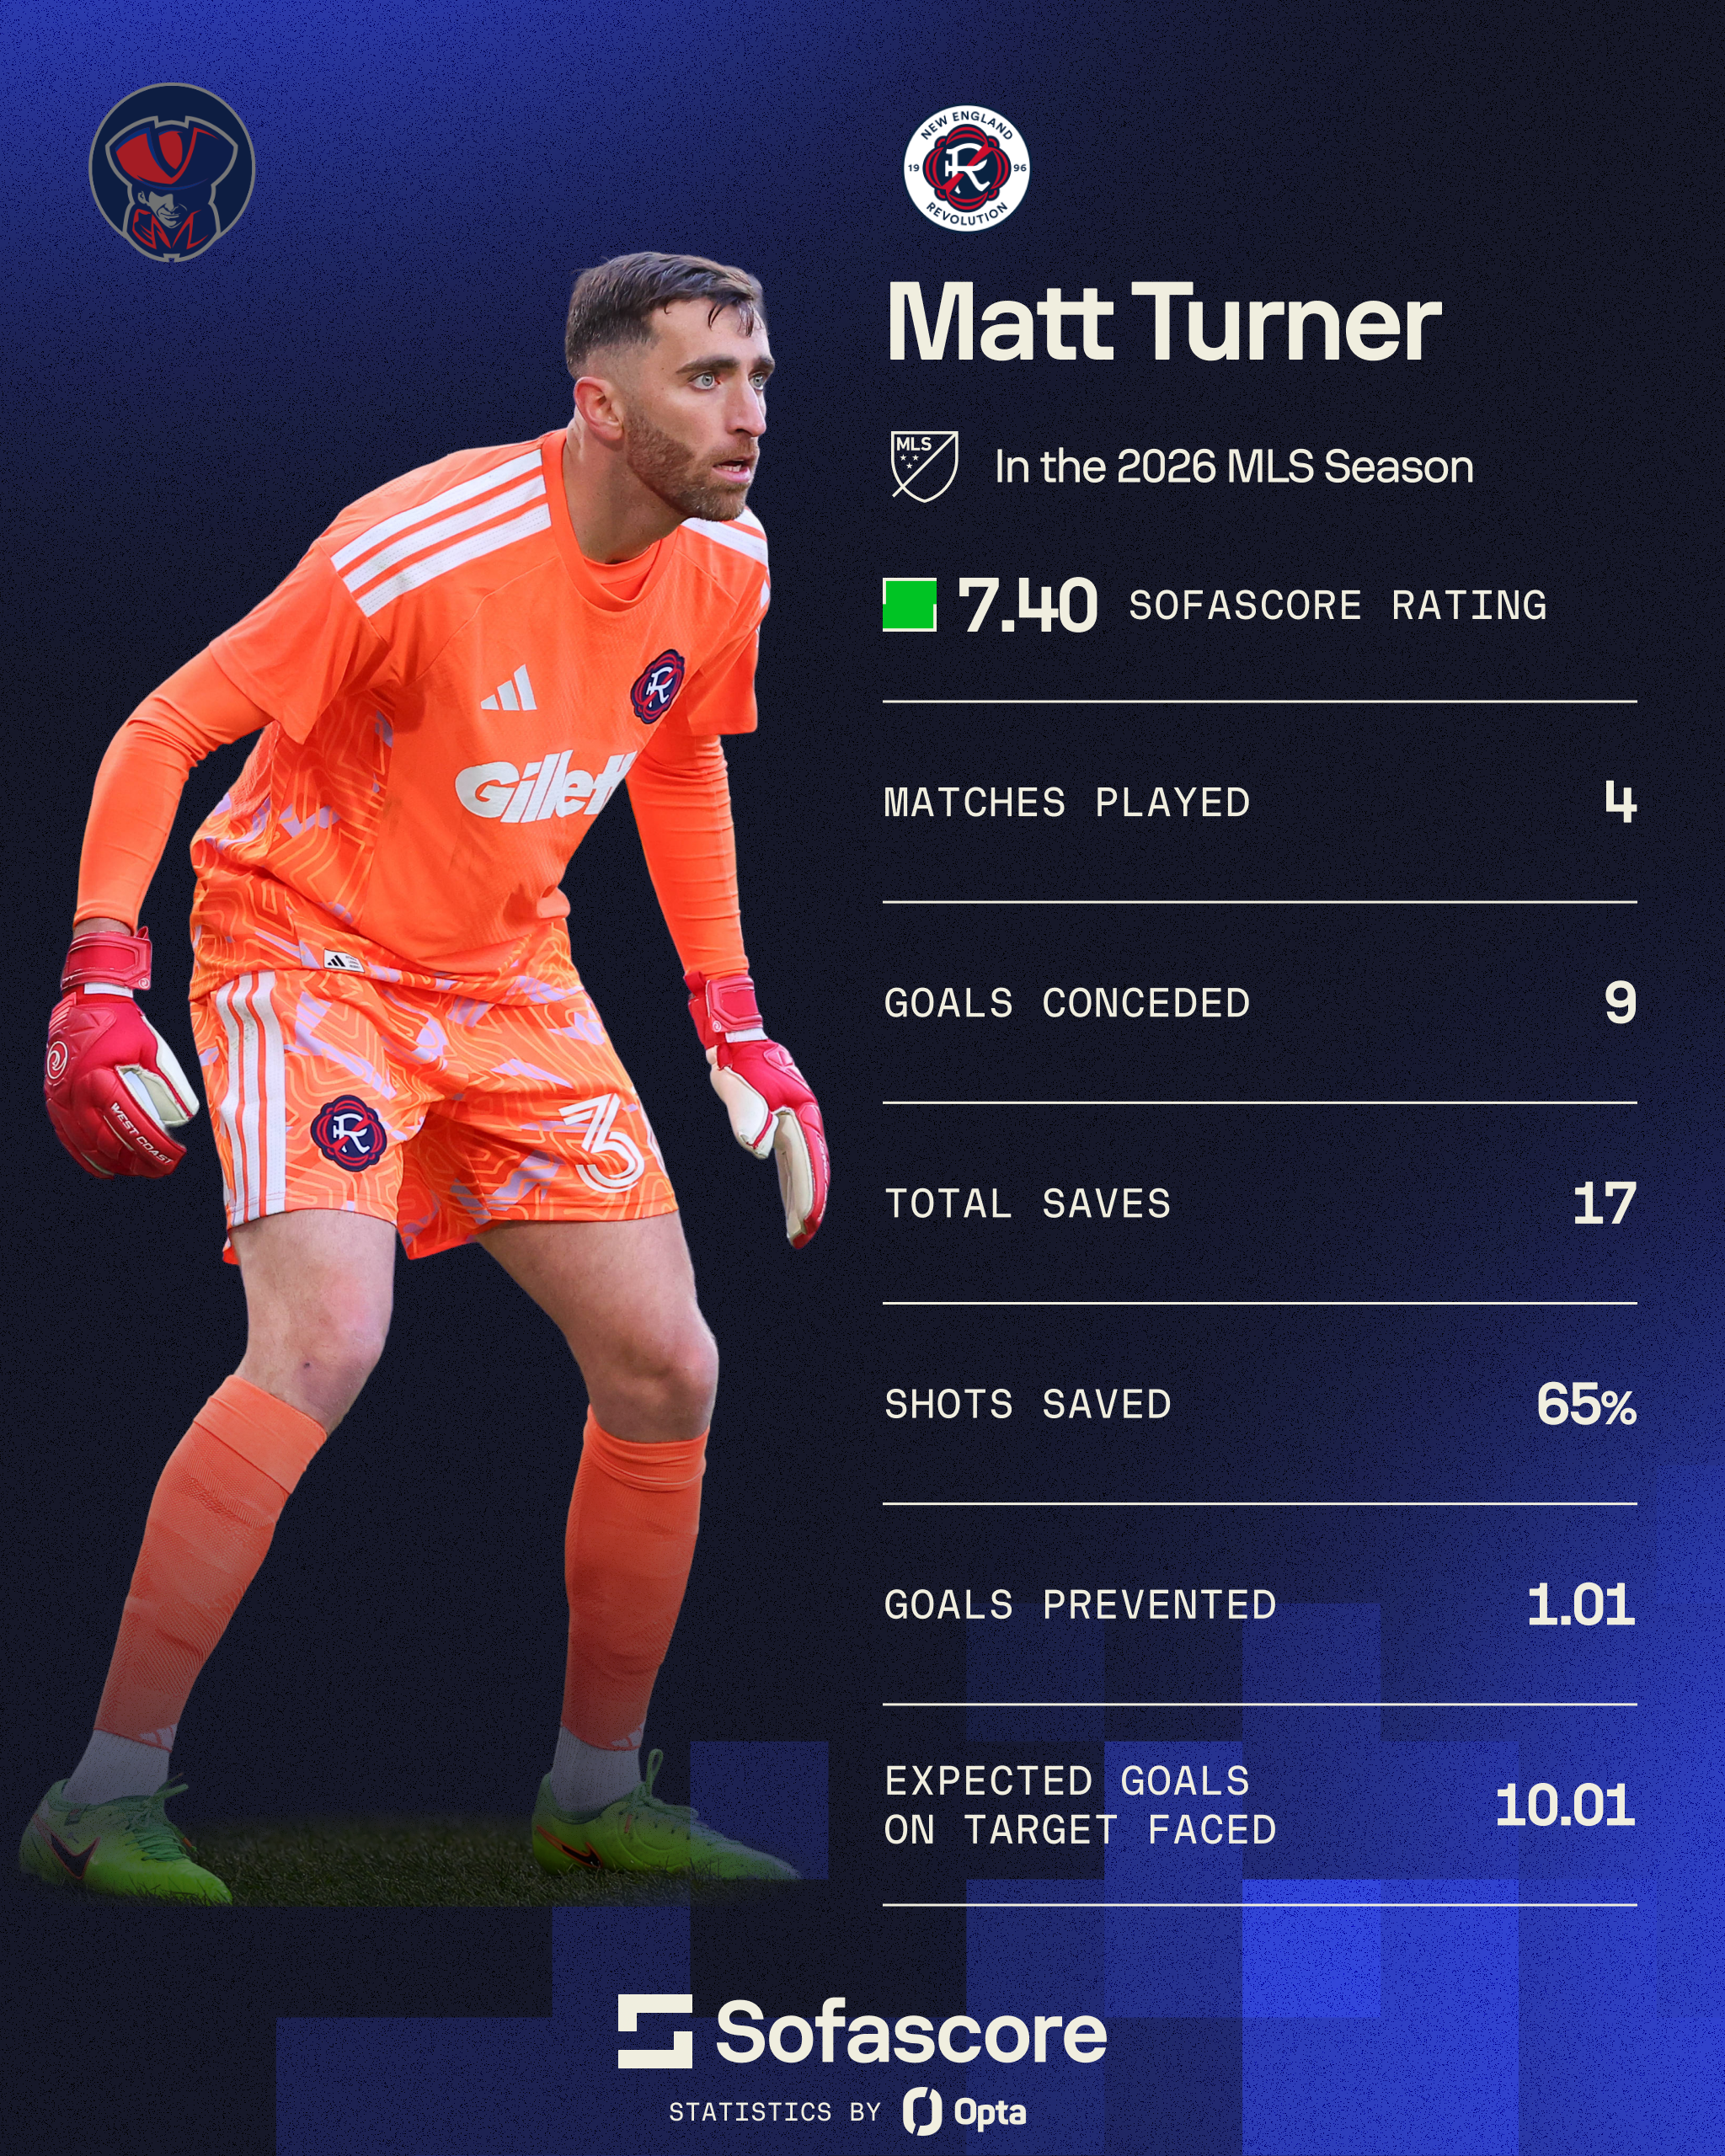
He departed for Arsenal after several productive seasons, culminating in an MLS All-Star nomination, and a Goalkeeper of the Year award in 2021. From a statistical perspective he played at a historic level during his time in New England. By the end of 2021 he owned 3 of the top 12 goals-prevented performances in league history, according to AmericanSoccerAnalysis. Included in that were the #1 and #2 best GA-xGA/90 stat totals in league history.
Following his departure, Djordje Petrovic stepped in to replace Turner and was (within his first season) also nominated for GKoTY. Petrovic actually broke Turner's record 0.42 goals-prevented-per-90 with a whopping 0.5 goals preventer per match. He made his own move across the pond to Chelsea in 2023.
Since then, New England has been feeling the effects of life without an elite shot-stopper. Or, rather, they were. Right up until Turner's return.
Above is a (sortable) table showing ASA shot-stopping data for every New England Revolution keeper since 2013 with at least 500 minutes of playing time. Notably exempt from that minutes requirement is 2026 Matt Turner, who has played every minute of the Revs 4 matches so far.
This chart shows 2 important stats, if your concern is with shot-stopping prowess.
First, 'goals allowed minus expected goals allowed per-90' (GA-xGA above) - which can be thought of goals prevented per match. The second stat is 'goals allowed per expected goals allowed per-90' (GA/xGA above). You can think of that stat as a facsimile of percentage of goals prevented.
What should stand out here is that from the time of Petrovic's departure in 2023 to Matt Turner's return in 2025 no goalkeeper had a GA/xGA below 1. That's to say all of them conceded as many or more goals per 90 than they were expected to.
In his return, Turner conceded about 79% of goals expected in 2025 and, through 4 matches in 2026, is clocking in at around 90% this season.
Things haven't gone quite as planned for Turner since his departure in 2022. His performances at the national team level have left some fans dissatisfied. Combine that negative press with a whopping 10 goals conceded and a reported Designated Player tag for 2026, and it's understandable that there's some negativity surrounding the keeper.
I think there's a reasonable argument to be made, however, that he provides some value, even at the price tag. Value that's apparently hard to come by in MLS. It's early but initial stats show what he's capable of.


