



Recently, I was a guest on The Blazing Musket Podcast to talk with Thomas Pinzone and Seth Macomber about the importance of statistics in soccer. It was a fun conversation, and I recommend you check it out.
One of the questions I was asked was related to the use of stats as a replacement for watching the games. Essentially, 'can you understand what happened just by looking at the stats after the fact?'
My response, which shouldn't come as much of a surprise, was that stats need to be interpreted within the full context of the match - which includes a full comprehension of how the game looked.
If you're looking for an illustration of what sort of context might affect your understanding of the stats, the Revs' last handful of games provide us with some really great examples.
The main mechanism I'm going to focus on here is game state. There are other factors that can affect quality of play, but I feel that game state is often overlooked when assessing a team's past performances.
In sports, "game states" are based on concepts with deep mathematical roots and founded on concepts from game theory and statistical modeling. Conceptually, it hinges on the idea that a set of conditions or events can give rise to a new set of conditions or events.

In layman's terms, however, we can think of it more simply as a moment-by-moment assessment of the match, and any related reaction to that assessment.
At any given moment in a soccer match, there are many variables that need to be taken into account. How much time is left? What's the score? How many goals does a team need to take the lead? How tired are the players and how many subs are remaining?
All of those, and many more, considerations are constantly updating throughout the course of 90 minutes. As a result, teams need to react to an ever-changing set of states. This is one of the reasons it's good to watch the games and view the stats in tandem, because watching the games gives a much clearer picture of the flow of game states.
Let's look at a few stats from the Revs' most recent match against the Chicago Fire. Stats and visualizations here will be pulled from the official MLS website.
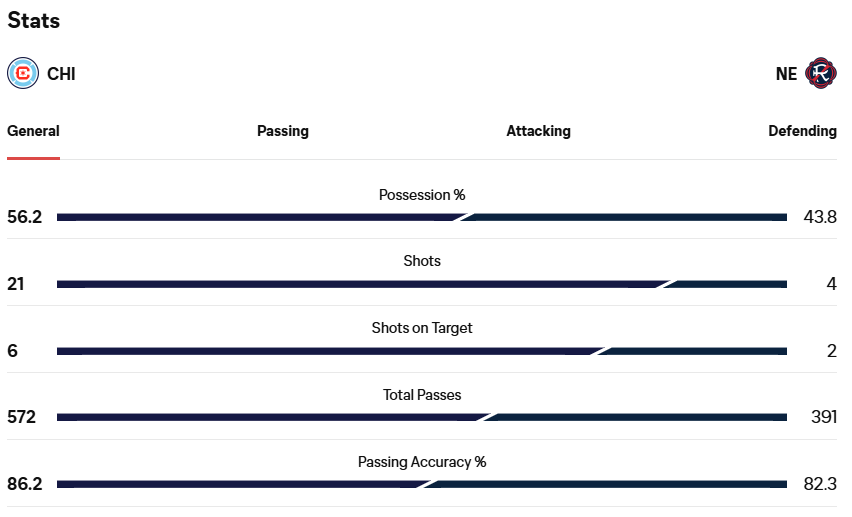
Straight from the box score, things don't look good for the Revolution. New England was out-possessed, out-passed, and out-shot by a wide margin. Drilling down further, we see a wide disparity in favor of Chicago in stats like shots on target, touches/shots within the penalty area, and expected goals.
And yet, New England won this match 2-1.
If you watched the match, you likely understand why the stats and scoreline don't match up well. The Revs took a 2-0 lead early in the second half, and parked the bus to see out a result.
The MLS match momentum chart gives a clear picture of that shift in tactics.
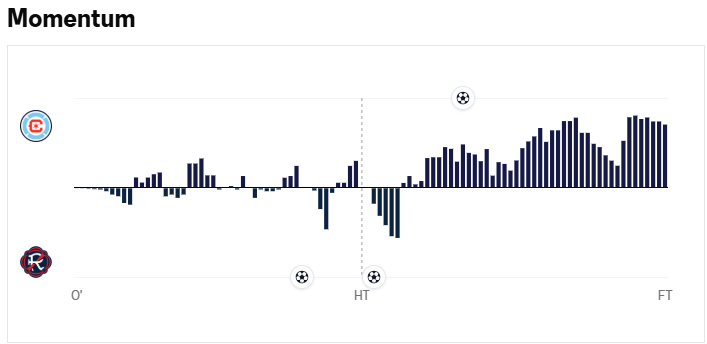
Match momentum is based on a combination of stats, and different stats providers will calculate it differently. So this isn't necessarily a chart you can rely on universally, but in this case we see a clear delineation between the mostly back-and-forth nature of the first 45 minutes and Chicago's dominance after the ~50th minute.
The game state changed dramatically after New England scored their goals, which necessitated a change in response from both teams. New England's win percentage jumped from ~25% to about 50% after scoring the first goal - good but tenuous. After the second goal, the win probability shot all the way up to 80%. This game-state enables New England to take fewer risks and likewise encourages Chicago to push numbers forward.
While it may be frustrating to watch as a Revs fan, there's a strong case to make that (given the game state in the second half) shoring up the defense and making your opponent break you down was the right choice. It was a gamble but, given New England's defensive track record (sixth fewest goals conceded in MLS), a justifiable gamble.
New England found themselves on the other end of a similar game state scenario against the LA Galaxy. The key difference being the quality of their opponent. While the Revs started their match away at Chicago with an estimated ~25% chance of victory, the odds were more in their favor in their road matchup in Los Angeles, settling in around 38% at the start of the match.
A Galaxy PK in the 11th minute would drop those odds substantially to just ~18%. Falling behind by 2 goals represents an obviously significant shift in game state, even if head coach Marko Mitrovic isn't following the live-odds ticker like some of us.
Again, the match momentum chart shows more attacking intent from New England and more defensive intent from the Galaxy in response to the change in state.
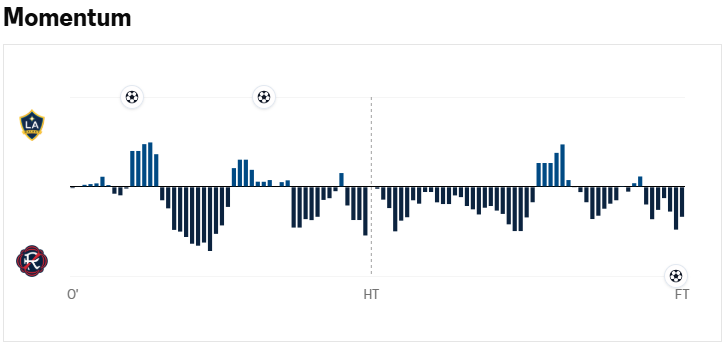
The initial goal caused New England to react by committing more numbers into the attack, occasionally moving players out of defensive positions. LA, meanwhile, was afforded the luxury of sitting back, limiting the Revs chances, and seeking opportunities to move quickly when New England was out of its shape.
That turned out to be an effective strategy for the Galaxy, who exploited open space up the left side of the field to score a second goal in the 33rd minute.
Robert Taylor scores his FIRST LA GALAXY GOAL 🤩 pic.twitter.com/eEfPsiFqh8
— LA Galaxy (@LAGalaxy) September 6, 2026
The second goal, once again, changed the game state. Up by two goals, LA was even more empowered to park the bus, and New England was forced to commit more to an aggressive, attack-first strategy in order to shift the game state to a more favorable position.
The Galaxy's strategy was, again, well suited to the moment. While New England would go on to dominate possession, passes, touches, and shots, most of its opportunities were from low-percentage scenarios.
Using the xG bucketing technique employed by @MLSStat over on Bluesky (which sorts chances into great/good/average/poor categories by xG) we can see that New England only generated 2 shots that qualified as better than average.
 MLS Analytics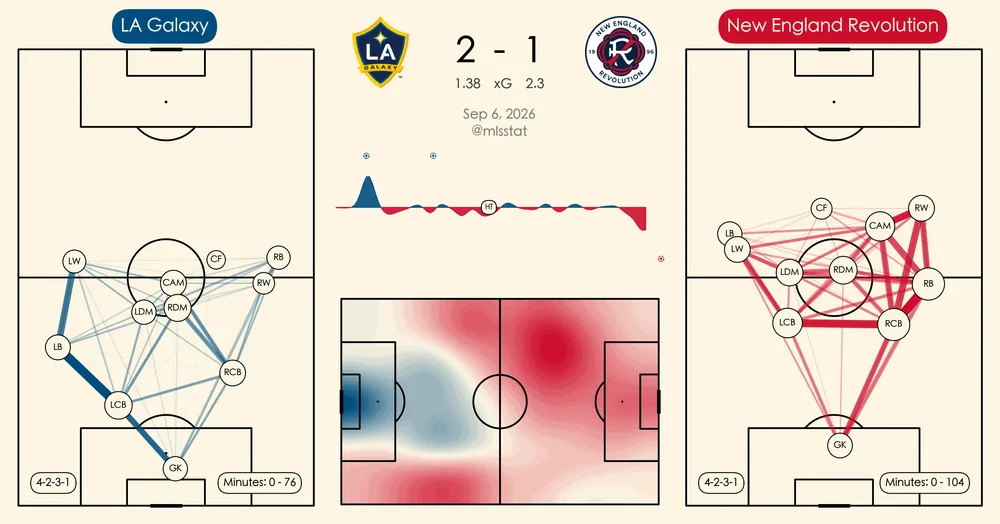
All of this is useful context to add to a box score that really seems to favor the Revolution.
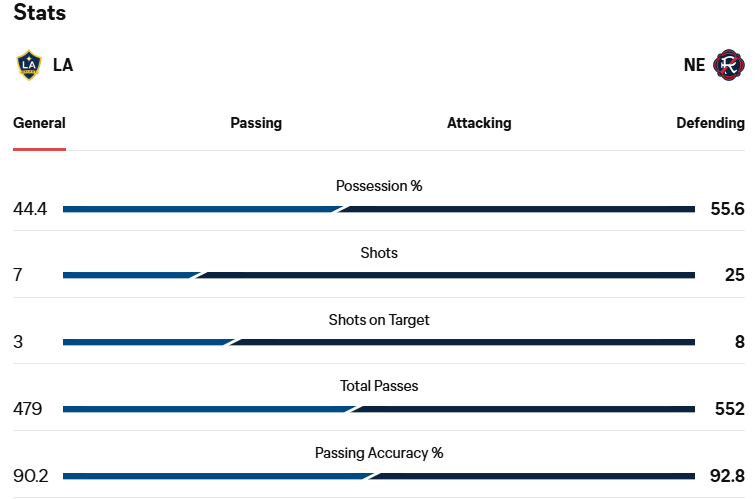
None of this is to say that the Revolution played poorly, mind you. New England hit the woodwork three times in this match (which is additional context that doesn't necessarily show up in stats).
The box score doesn't tell the full story.
In all matches, game state drives both teams to react to the changing situation. In the cases laid out in this article, however, those reactions gave rise to some misleading final numbers. It can be tempting to point to individual stats and draw conclusions but, without grounding those numbers in the surrounding context, you may find you have an incomplete understanding.


