Examining How Well Luca Langoni And Alhassan Yusuf Need to Perform to Help New England Make Playoffs?
A statistical look at New England's roster
I won’t lie to you, dear reader, when I started the research for this piece the Revs were still firmly in “Q3”. The Revs had recently crashed out of the Leagues Cup and were staring at a busy, but vital, final slate of games ahead of the playoffs. Pumpkin spice lattes hadn’t yet hit cafe menus nationwide.
New England had just announced the signings of Argentine winger Luca Langoni, and Nigerian defensive midfielder Alhassan Yusuf. Both players are thought to be improvements at positions of need for the Revolution. Both have strong pedigrees (Langoni with Boca Juniors and Yusuf with UCL experience) backing up the high expectations foisted upon them. With the path to a potential playoff appearance looking narrow, the Revolution are going to need each of those players to be great in order to succeed.
But, how great?
That’s what I set out to figure out. How good does Langoni need to be to elevate New England’s attack? How good does Yusuf need to be to help them reach the playoffs?
Methodology/Caveats
In order to attempt to tackle this question I needed three things. The first thing I needed was to determine which metric to use as a standard - to compare teams and players.
I ended up selecting AmericanSoccerAnalysis’ “Goals Added”. While there are downsides (we’ll get to those), “G+” does have the benefit of allowing you to compare players across positions as opposed to individual stats that may not apply evenly across the field.
Goals added is calculated by assigning a value to each action a player takes during a game. If the action makes it more likely that their team will score (or less likely that their team will concede) they are assigned a positive value for the action. Likewise in the opposite scenario, except they would receive a negative value. At the end of the game, all those values are added together to create a cumulative “goals added” number.
The downside here is that while it does put all players on an even statistical playing field, the truth is that certain position groups are more likely than others to take high-value touches closer to goal. Those touches near net are generally worth higher G+ values. This means that good attackers (and good goalkeepers) tend to have much higher G+ than good central midfielders, for example.
Additionally, while G+ can be normalized to a per-90’ basis, individual games can swing wildly game-to-game. That tends to balance out over the course of a season, but low-sample-size can be a factor. For that reason I’ve opted to use the cumulative values which reward longevity. Positive values are indicative of consistently good play, and negative values are indicative of consistently poor play.
With a statistical standard selected, the second thing I needed was to get an understanding of how New England’s G+ looked, at this point in the season.
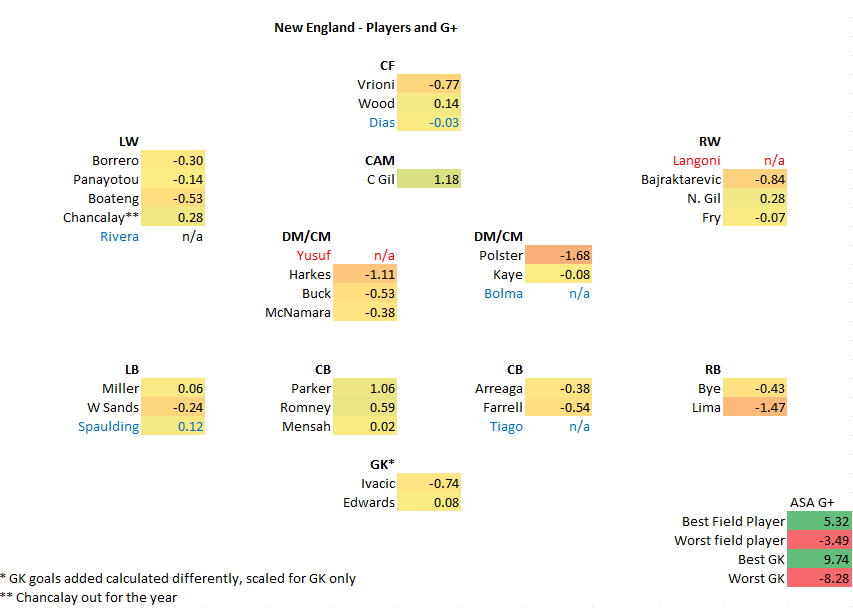
This, above, represents my best understanding of the roster and depth for each position with each player’s associated G+ value next to their names. For the purposes of this article, I tried to assign players to only a single position, even if they could play in multiple spots.
It’s worth noting that these values may have changed slightly since I pulled the data - in the pre-pumpkin-spice times.
The last thing I needed were some benchmarks to compare to. I put together similar G+ rosters for several teams, across two categories.
How Do the Revs Compare to the Best MLS Clubs?
The first is the “best-in-class” category which includes the four teams with the highest points-per-game in MLS at time of data collection, Miami, LAFC, Cincinnati, and Columbus. Comparing New England to these teams tells us how far the Revs have to climb to be a serious MLS Cup contender.
Much like I did with the Revs roster above, I sorted the players on each of those four teams into positions on their rosters. I then tabulated each players respective G+ value, and averaged those values across all teams by positional group.
It should come as no surprise that New England (near the bottom of the league standings) is not particularly close to performing like the league’s best clubs.
New England’s starters are in the dark gray here, while the lighter gray represents an averaged G+ value from the best clubs in MLS. Values below zero indicate poor play and values above zero indicate good play.
What’s worth noting about this chart is that, while the Revs need significant improvements at almost every position, the attacking positions are where New England most struggle in this comparison. The largest gap between the Revolution’s starters and a top team starter is at center forward. The third largest is at winger, fourth largest attacking midfield. Surprisingly, the Revs fare better than the league’s best teams at center back.
MLS, as a league, does tend to gravitate toward better attacking teams finding the most success. Thus this may not be entirely surprising. New England fans will remember 2021’s attacking output fondly, for example.
How Much Do They Need to Improve to Make the Playoffs?
The next category for comparison is a bit more attainable. If we estimate that the ninth place spot (the final play-in spot for the playoffs) will require a similar number of points as previous seasons, New England will need to finish somewhere around 39-42 points. Using the most charitable end of the spectrum, they would need to perform at a ~1.5 points per game pace for the rest of the season.
Using that ppg pace, I selected a “playoff-pace” category of comparators that sit on or around 1.5ppg. These include NYCFC, Seattle, Portland, and New York Red Bulls.
Once again, I have compared New England’s starting XI to an average starting XI of the teams listed above, with the Revs in the darker gray.
The gap between New England and their 1.5 ppg counterparts is smaller than as compared to the top teams in MLS. It’s especially noticeable at attacking midfield and at full back.
For this set of teams, I also decided to compare New England’s depth. Most teams have a significant G+ dropoff from their starters to their reserves (often a function of playing time) and the teams we are comparing to here were no exception.
Comparatively, New England actually appears to have better depth at CF, and CB than those teams I listed earlier. They also have a smaller drop-off in quality of their depth.
In fact, the drop-off in G+ from New England’s starters to their reserves is less severe than the “playoff pace” G+ average at every position.
I’d hazard that that’s likely related to the relatively depressed G+ values attributed to the starters, but it’s comforting to know that the drop-off from starters to depth appears to be small.
Where Did The Revs Need the Biggest Improvements?
New England smartly determined that central/defensive midfielder and wide attacker were two positions that needed improving. In fact, the two largest G+ deficits between New England’s starting field players and those of an average 1.5-ppg team were at winger and at CDM.
Goalkeeper is the largest overall, but that data is heavily affected by the inclusion of Matt Freese of NYCFC, which G+ lists as (far and away) the best keeper in the league. If you remove Freese from the equation, New England actually fairs slightly better than the average of their ~1.5-ppg counterparts.
This chart also shows that New England desperately needs to add a striker, and likely should have done so in the summer.
As it pertains to winger and CDM, though, New England did make moves to address those positions. So…
How Good do Langoni and Yusuf Need to Be?
If we stipulate that Borrero is the most likely winger to start alongside Langoni, for the remainder of the season, we can work backwards to determine what sort of G+ value he’d need to achieve in order to put New England’s wingers on pace with the wingers on our “playoff pace” teams.
Calculating backwards from the “playoff-pace” winger G+ average (0.943) — Langoni’s G+ value would need to be 2.185 to put New England on par with those teams.
Since the G+ values used in this calculation are cumulative over time, it doesn’t really make sense to use that value as a specific target for Langoni.
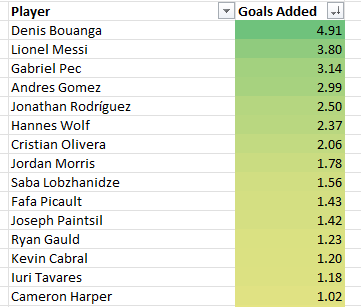
A better way to think of it would be that in order to attain the average winger G+ value (as compared to teams already on New England’s required playoff pace) Langoni would need to provide a value consistent with the seventh best winger in MLS. Somewhere between Hannes Wolf of NYCFC and Christian Oliveira of LAFC.
It’s early days, but with two goals and one assist within his first three appearances - that may just be attainable.
Turning our attention to Alhassan Yusuf, who has yet to play for New England, our target “playoff pace” central/defensive midfield G+ average value is -0.499. This means that Yusuf would need a value of of 0.683 to put New England on level terms.
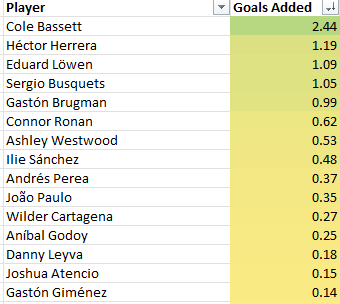
Therefore, he’d likely need to perform at a level consistent with the 6th best CM/DM in MLS. Somewhere between Connor Ronan of the Colorado Rapids and Gaston Brugman of the LA Galaxy.Time will tell if he can provide that kind of value.
Of course, he may not need to. And the same goes for Langoni.
G+ is a performance based metric, and as a result there’s potential that positive play from either player - even if not to those levels - could help lift their teammates performances as well. Better play from a few individuals can help put the team in better positions to score, which could have a knock-on effect on the G+ performances of the players around them.
It will certainly be interesting to watch how these players fit in, and how they’re able to contribute as the season draws to a close.


